Graphing Quadratic Functions
The Graph of f(x) = Ax2 + Bx + C
Example 1The graph of y = 0.5x2 is shown. Assume that the coefficient of x2 for all
three graphs is 0.5.
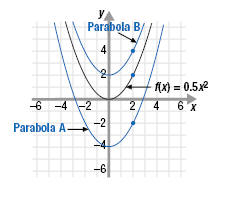
a. Find the equation of Parabola A.
b. Find the equation of Parabola B.
Solution
a. Parabola A is the graph of f(x) = 0.5x2 shifted down 4 units.
So, it is the graph of the function f(x) = 0.5x2 - 4.
b. Parabola B is the graph of f(x) = 0.5x2 shifted up 2 units.
So, it is the graph of the function f(x) = 0.5x2 + 2.
Example 2
Graph the functions:
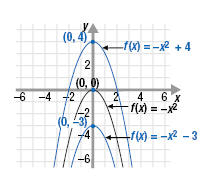
a. f(x) = -x2
b. f(x) = -x2 + 4
c. f(x) = -x2 - 3
Solution
a. The function f(x) = -x2 has the same shape as f(x) = x2 but, because
of the negative sign, it opens downward. To see this, we can calculate
and plot a few ordered pairs.
|
x |
f(x) = -x2 |
(x, y) |
|
-2 -1
0
1
2 |
f(-2) = -(-2)2 = -4 f(-1) = -(-1)2 = -1
f(0) = -(0)2 = 0
f(1) = -(1)2 = 1
f(2) = -(2)2 = -4 |
(-2, -4) (-1, -1)
(0, 0)
(1, -1)
(2, -4) |
b. The graph of f(x) = -x2 + 4 has the same shape as f(x) = -x2 but is
shifted up 4 units.
c. The graph of f(x) = -x2 - 3 has the same shape as f(x) = -x2 but is
shifted down 3 units.
|