Exponential Decay
An exponential decay function is an exponential function where the
base, b, is in the interval 0 < b < 1. The graph of an exponential decay
function decreases when moving from left to right.
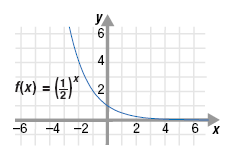
For example, the function
 is an exponential decay function
since the base, is an exponential decay function
since the base,
 , is between 0 and 1. , is between 0 and 1.

From the graph, notice the following:
• The graph of the exponential decay function decreases when moving
from left to right.
• The graph intersects the y-axis at (0, 1).
• The domain is all real numbers.
• The range is all positive real numbers.
Let’s look at the relation between an exponential growth function and an
exponential decay function.
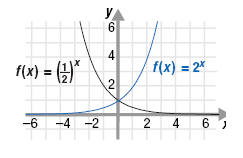
On the grid are the graphs of f(x) = 2x and


Notice that:
• The graph of
 is a reflection about the y-axis of the
graph y = 2x. is a reflection about the y-axis of the
graph y = 2x.
• Both graphs approach, but never quite reach, the x-axis.
Thus, we say that the x-axis is an asymptote of each graph.
This is why the range is (0, +∞) for both functions.
|