Algebra Tutorials!
   
Wednesday 22nd of January  
   
Home
Exponential Decay
Negative Exponents
Multiplying and Dividing Fractions 4
Evaluating Expressions Involving Fractions
The Cartesian Coordinate System
Adding and Subtracting Fractions with Like Denominators
Solving Absolute Value Inequalities
Multiplying Special Polynomials
FOIL Method
Inequalities
Solving Systems of Equations by Graphing
Graphing Compound Inequalities
Solving Quadratic Equations by Completing the Square
Addition Property of Equality
Square Roots
Adding and Subtracting Fractions
The Distance Formula
Graphing Logarithmic Functions
Fractions
Dividing Mixed Numbers
Evaluating Polynomials
Power of a Product Property of Exponents
Terminology of Algebraic Expressions
Adding and Subtracting Rational Expressions with Identical Denominators
Solving Exponential Equations
Factoring The Difference of 2 Squares
Changing Fractions to Decimals
Solving Linear Equations
Using Patterns to Multiply Two Binomials
Completing the Square
Roots of Complex Numbers
Methods for Solving Quadratic Equations
Conics in Standard Form
Solving Quadratic Equations by Using the Quadratic Formula
Simplifying Fractions 2
Exponential Notation
Exponential Growth
The Cartesian Plane
Graphing Linear Functions
The Slope of a Line
Finding Cube Roots of Large Numbers
Rotating Axes
Common Mistakes With Percents
Solving an Equation That Contains a Square Root
Rational Equations
Properties of Common Logs
Composition of Functions
Using Percent Equations
Solving Inequalities
Properties of Exponents
Graphing Quadratic Functions
Factoring a Polynomial by Finding the GCF
The Rectangular Coordinate System
Adding and Subtracting Fractions
Multiplying and Dividing Rational Expressions
Improper Fractions and Mixed Numbers
Properties of Exponents
Complex Solutions of Quadratic Equations
Solving Nonlinear Equations by Factoring
Solving Quadratic Equations by Factoring
Least Common Multiples
http:
Solving Exponential Equations
Solving Linear Equations
Multiplication Property of Equality
Multiplying Mixed Numbers
Multiplying Fractions
Reducing a Rational Expression to Lowest Terms
Literal Numbers
Factoring Trinomials
Logarithmic Functions
Adding Fractions with Unlike Denominators
Simplifying Square Roots
Adding Fractions
Equations Quadratic in Form
Dividing Rational Expressions
Slopes of Parallel Lines
Simplifying Cube Roots That Contain Variables
Functions and Graphs
Complex Numbers
Multiplying and Dividing Fractions 1
Composition of Functions
Intercepts of a Line
Powers
http:
Multiplying Two Numbers with the same Tens Digit and whose Ones Digits add up to 10
Factoring Trinomials
Exponents and Polynomials
Decimals and their Equivalent Fractions
Negative Integer Exponents
Adding and Subtracting Mixed Numbers
Solving Quadratic Equations
Theorem of Pythagoras
Equations 1
Subtracting Fractions
Solving Quadratic Equations by Graphing
Evaluating Polynomials
Slope
Angles and Degree Measure
   
Try the Free Math Solver or Scroll down to Tutorials!


Please use this form if you would like
to have this math solver on your website,
free of charge.


Graphing Logarithmic Functions

Example
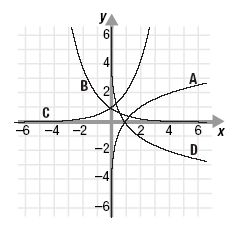
Graphs A, B, C, and D represent functions of the form y = bx and y = logbx, where b is the base of each function. Here, b > 0 and b 1.

a. Which graph represents an exponential function where b > 1?

b. Which graph represents an exponential function where 0 < b < 1?

c. Which graph represents a logarithmic function where b > 1?

d. Which graph represents a logarithmic function where 0 < b < 1?

Solution

a. Graph C. Because b > 0, the y-values of an exponential function will all be positive. Also, because b > 1, as the x-values increase, the y-values will increase. (The function for graph C is y = 2x.)

b. Graph B. Because b > 0, the y-values of an exponential function will all be positive. Because 0 < b < 1, as the x-values increase, the y-values will decrease. (The function for graph B is )

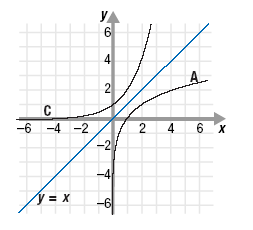
c. Graph A. The inverse of a logarithmic function where b > 1 is an exponential function where b > 1. If the graph of an exponential function where b > 1 (such as graph C) is reflected across the line y = x, we obtain a graph like graph A. (The function for graph A is y = log2x.)
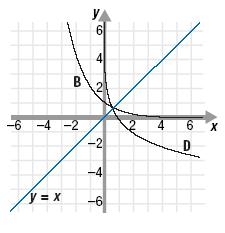
d. Graph D. The inverse of a logarithmic function where 0 < b < 1 is an exponential function where 0 < b < 1. If the graph of an exponential function where 0 < b < 1 (such as graph B) is reflected across the line y = x, we obtain a graph like graph D. (The function for graph D is y = log 1/2 x.)
Copyrights © 2005-2025